Tableau Trend line helps to provide the highlight of trending data. The Trend line is created based on the two axes fields that should be interpreted as a number. Tableau provides different types of trend line models such as Logarithmic, Power, Exponential, Linear, and Polynomial. Trend line works on the statical model to provide the prediction of the future trend by using the existing data. Based on these Trend lines users can predict future data for analysis and decision making. To Create the Tred line Tableau consider a dimension of time and a measure field.
Tableau Trend Line Creation
We will use the default data set "Sample-superstore" and find out the future value of measure PROFITS for the upcoming year.
Let's follow the below steps to create Tableau Trend Line.
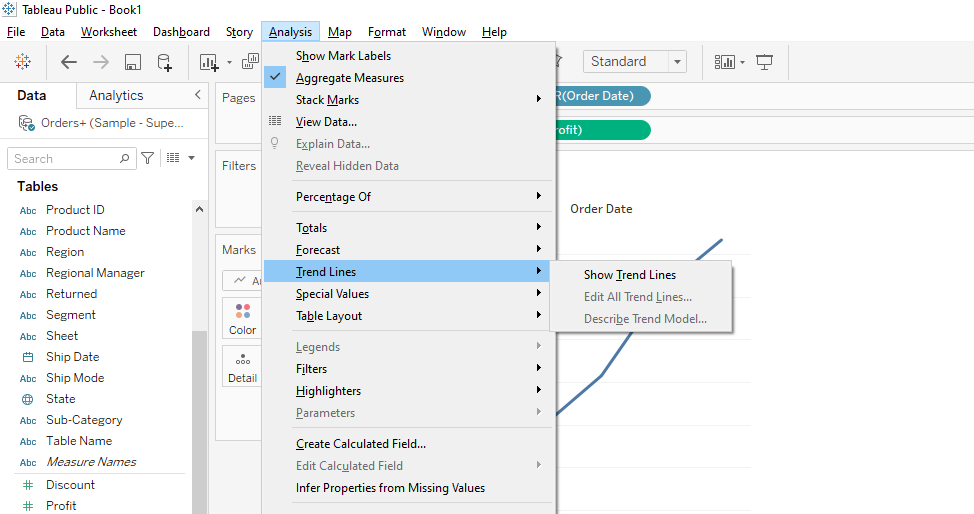
Step 1:-
Let's drag and Drop the ORDER-DATE dimension in the columns section and PROFITS measure into the rows. We will see the default LINE CHART will be created. Now go to the Analysis Menu -> Trend Lines -> Show Trend Lines.
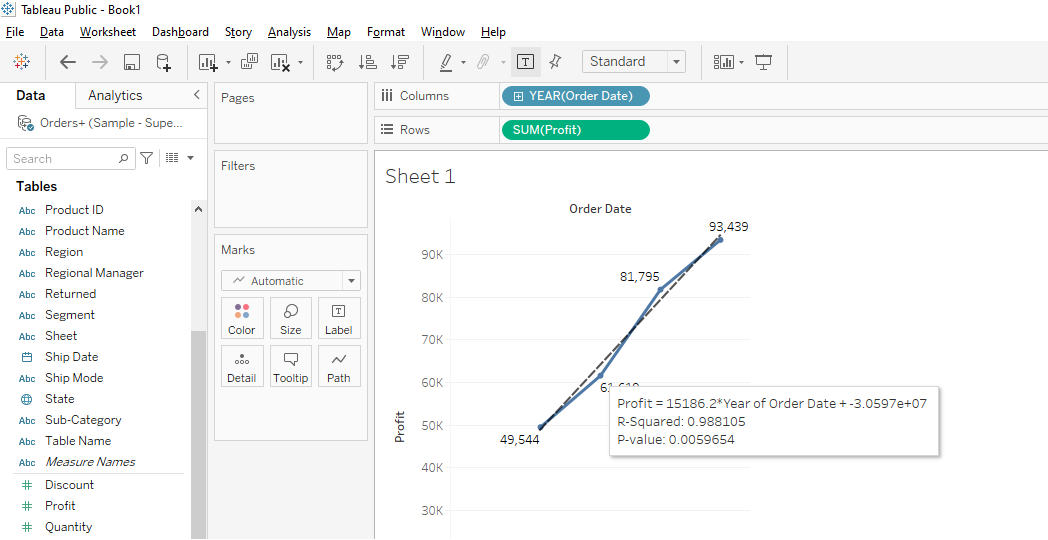
Step 2:-
The below LINE CHART has been created that provides the mathematical expression of the correlated fields and the value of P-Value and the R-Squared.
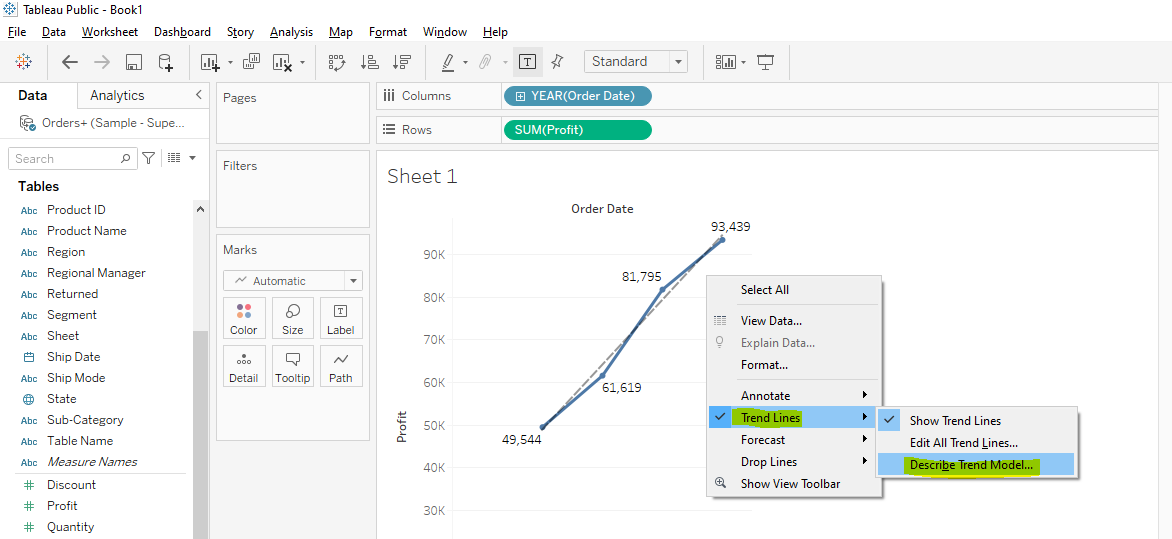
Describe the Tableau Trend Line
To get more detail of Tableau Trend Line, right-click on the table and go to Trend Line ->Describe Trend Model. It will provide detail such as coefficients, intercept value, and the equation.