The Tableau Show Me panel is used to apply a view of the existing selected data. For example, the view can be a pie chart, line chart, that can be created on data for further analysis. The Tableau Show Me can be opened from the toolbar.
Now let us see some of the examples of Tableau Show me in the following section.
Show Me with One or More Fields
To analyze the relation between two or more fields can be done using various Graphs, Charts provided by Tableau Show Me. We can select the appropriate fields from the Data pane, and select the particular view from the Show me. Tableau automatically suggests the best view for the selected fields data.
Let's follow the following steps to perform this operation.
Step 1:-
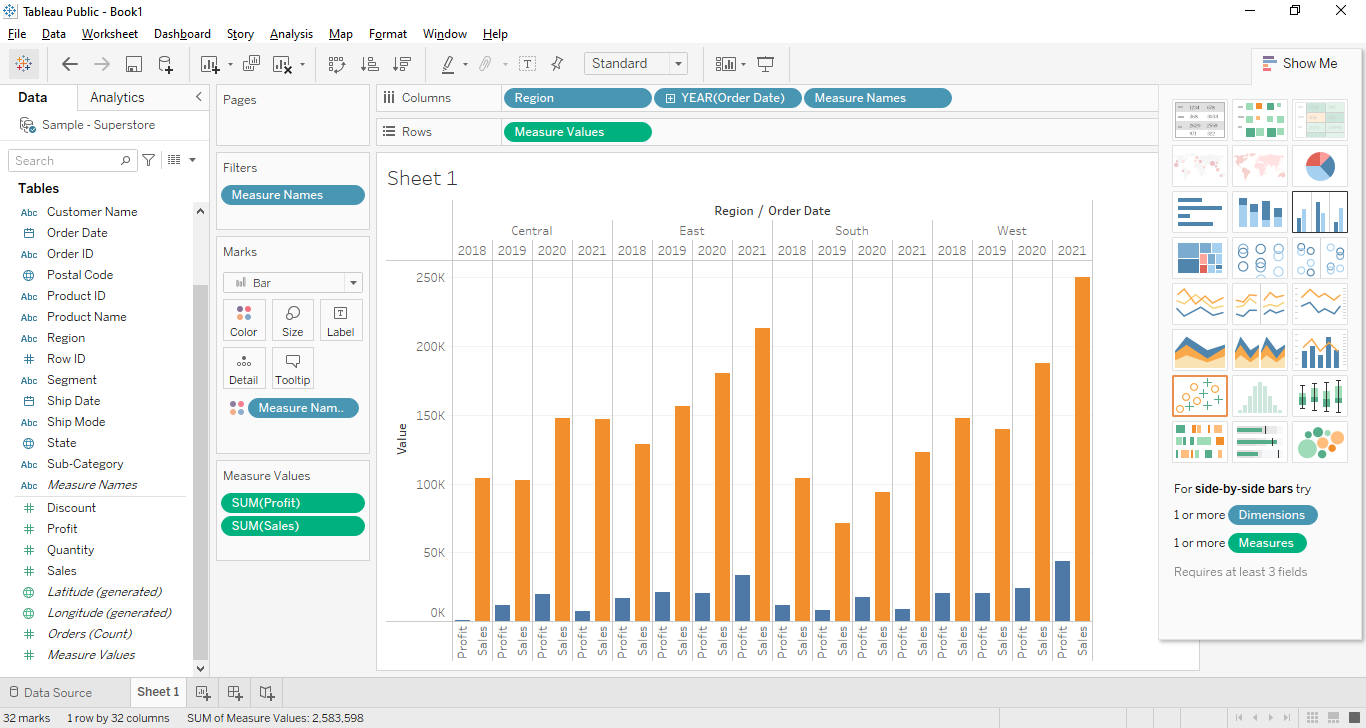
Go to the Data Pane, and select the appropriate field that we want to analyze, to select multiple fields press CTRL and click on the required fields. Put the Dimension fields(Order Date, Region) in the Columns section and Measure fields(Profile, Sales) in the Rows section.
Step 2:-
Now click on the Tableau Show me that is located on the right side of sheet1 and select any view, In the below figure we have selected the SIDE-BY-SIDE Bars and the following chart has been created.
Show Me with Line Chart
The same technique can be applied to create a Line Chart. Let's see the example of creating a Line Chart using the Tableau Show Me.
Step 1:-
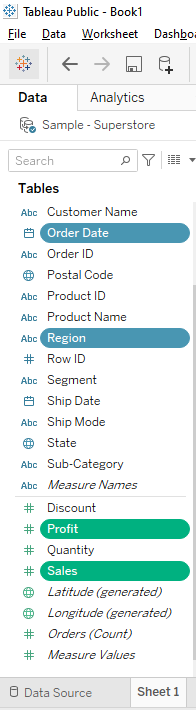
From the Data Pane, let's select the Order Date and Profit by holding the CTRL-key.
Step 2:-
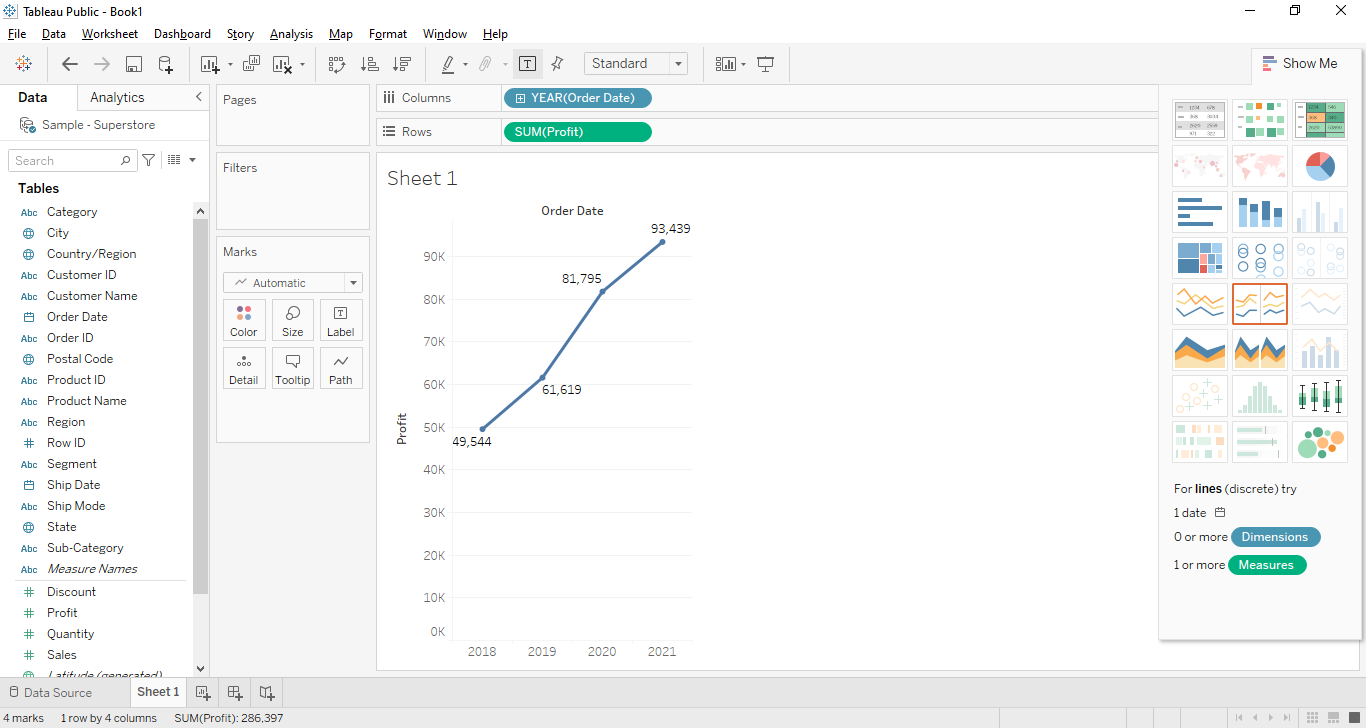
Now click on the Tableau Show me and select the Line Chart as mentioned in the below figure. Once the Line Chart is selected the following view will be created. To see the points we can enable the Show Mark Labels from the toolbar.