Tableau is a very famous Business Intelligence tool, the world's leading Data Analytics software that is used by many organizations across the globe to perform data visualization. Users can connect Tableau with the different data sources, on-premise storage systems, or the cloud system and get the insight of data in the form of Graphs, sharable Dashboards, Charts, and so on. Some of the Tableau features include the end to end content discovery, data preparation, application programming interface (APIs) integration, automatic updates, user security management, metadata management, and so on. Tableau offers the products such as Tableau Desktop, Tableau Online, Tableau Server, Tableau Prep Builder, Tableau Public, Tableau Mobile, Tableau Reader. Gartner has named Tableau a leader in the Analytics and Business Intelligence Platforms.

Features of Tableau
Tableau comes with various unique features and the following is the list of some of the important features of Tableau.
1. Data Visualization
Tableau is the master in Data visualization. It read row data from different sources to create different types of beautiful sharable Dashboard, Graphs, Charts which provides the insight of data to understand more and make decisions that are difficult using the spreadsheet. Tableau is on the top in the Data visualization, and working towards this direction directly.
2. Centralized Data
The Centralized Location Data feature of Tableau is used to manage published data sources of an organization such as change permission, add tags, deletion, and managing the schedule for a location. To refresh the data, the administrator can define certain times for extraction and a full and incremental refresh.
3. Easy To Create Interactive Visualizations
Users can create Interactive Visualizations by utilization the color, trend line, graphs with just a drag and drop functionality of Tableau. Various variations can be created in Tableau but at the same time, it restricts the creation of Charts that are against the best practice of Data Visualizations.
4. Tableau Self Relient
The Tableau Installation is not a complex process and is easily done. Most Organizations are using the Tableau Desktop that can be installed in easy steps and contain all the necessary features to start the data analytics.
5. Tableau Can Handle Huge Data
Tableau is capable of handling millions of records without hampering the performance and a variety of visualization can be created on that data. Tableau also provides the facility to make a live connection with different data sources such as SQL, etc.
6. Tableau Architecture Agnostic
Tableau can work on different types of devices where data flows, and the user needs not worry about the selection of a particular software or hardware configuration to run the Tableau.
7. Combine Different DataSets
Tableau allows users to combine different types of data sets in real-time such as structure, semi-structure, row data that too without doing complex integrations, and the user has fewer worries about how the data is stored.
8. Responsive Dashboard and Mobile Support
Tableau provides a great feature to customize the Dashboard for different devices such a Mobile, Desktop, Tablets. So whenever the user is accessing the Tableau Dashboard, it automatically identifies the devices and presents the right Dashboard.
History of Tableau
Let us see the Year-By-Year evaluation of Tableau.
2003: In January the same year, Tableau was founded by Pat Hanrahan, Christian Chabot, and Chris Stolte.
2016: In August same year, Adam Selipsky was appointed as the president and CEO of Tableau.
2018: In June same year, Tableau obtained the Empirical Systems that is a startup-based artificial intelligence company to integrate the AI in Tableau.
2019: In June same year, Salesforce acquired Tableau with a deal of $15 billion.
2021: In March the same year, Mark Nelson was appointed as the president and CEO of Tableau.
Tableau Environment
The following figure represents the Tableau Environment or the Tableau Universe in which there are different products and the main product is Tableau Desktop. As a user, you will connect with the data source and get the output in Tableau. So the Tableau Environment surrounds the data source, Tableau Desktop, Tableau Reader, Tableau Server family, and so on to perform the analytical operation.
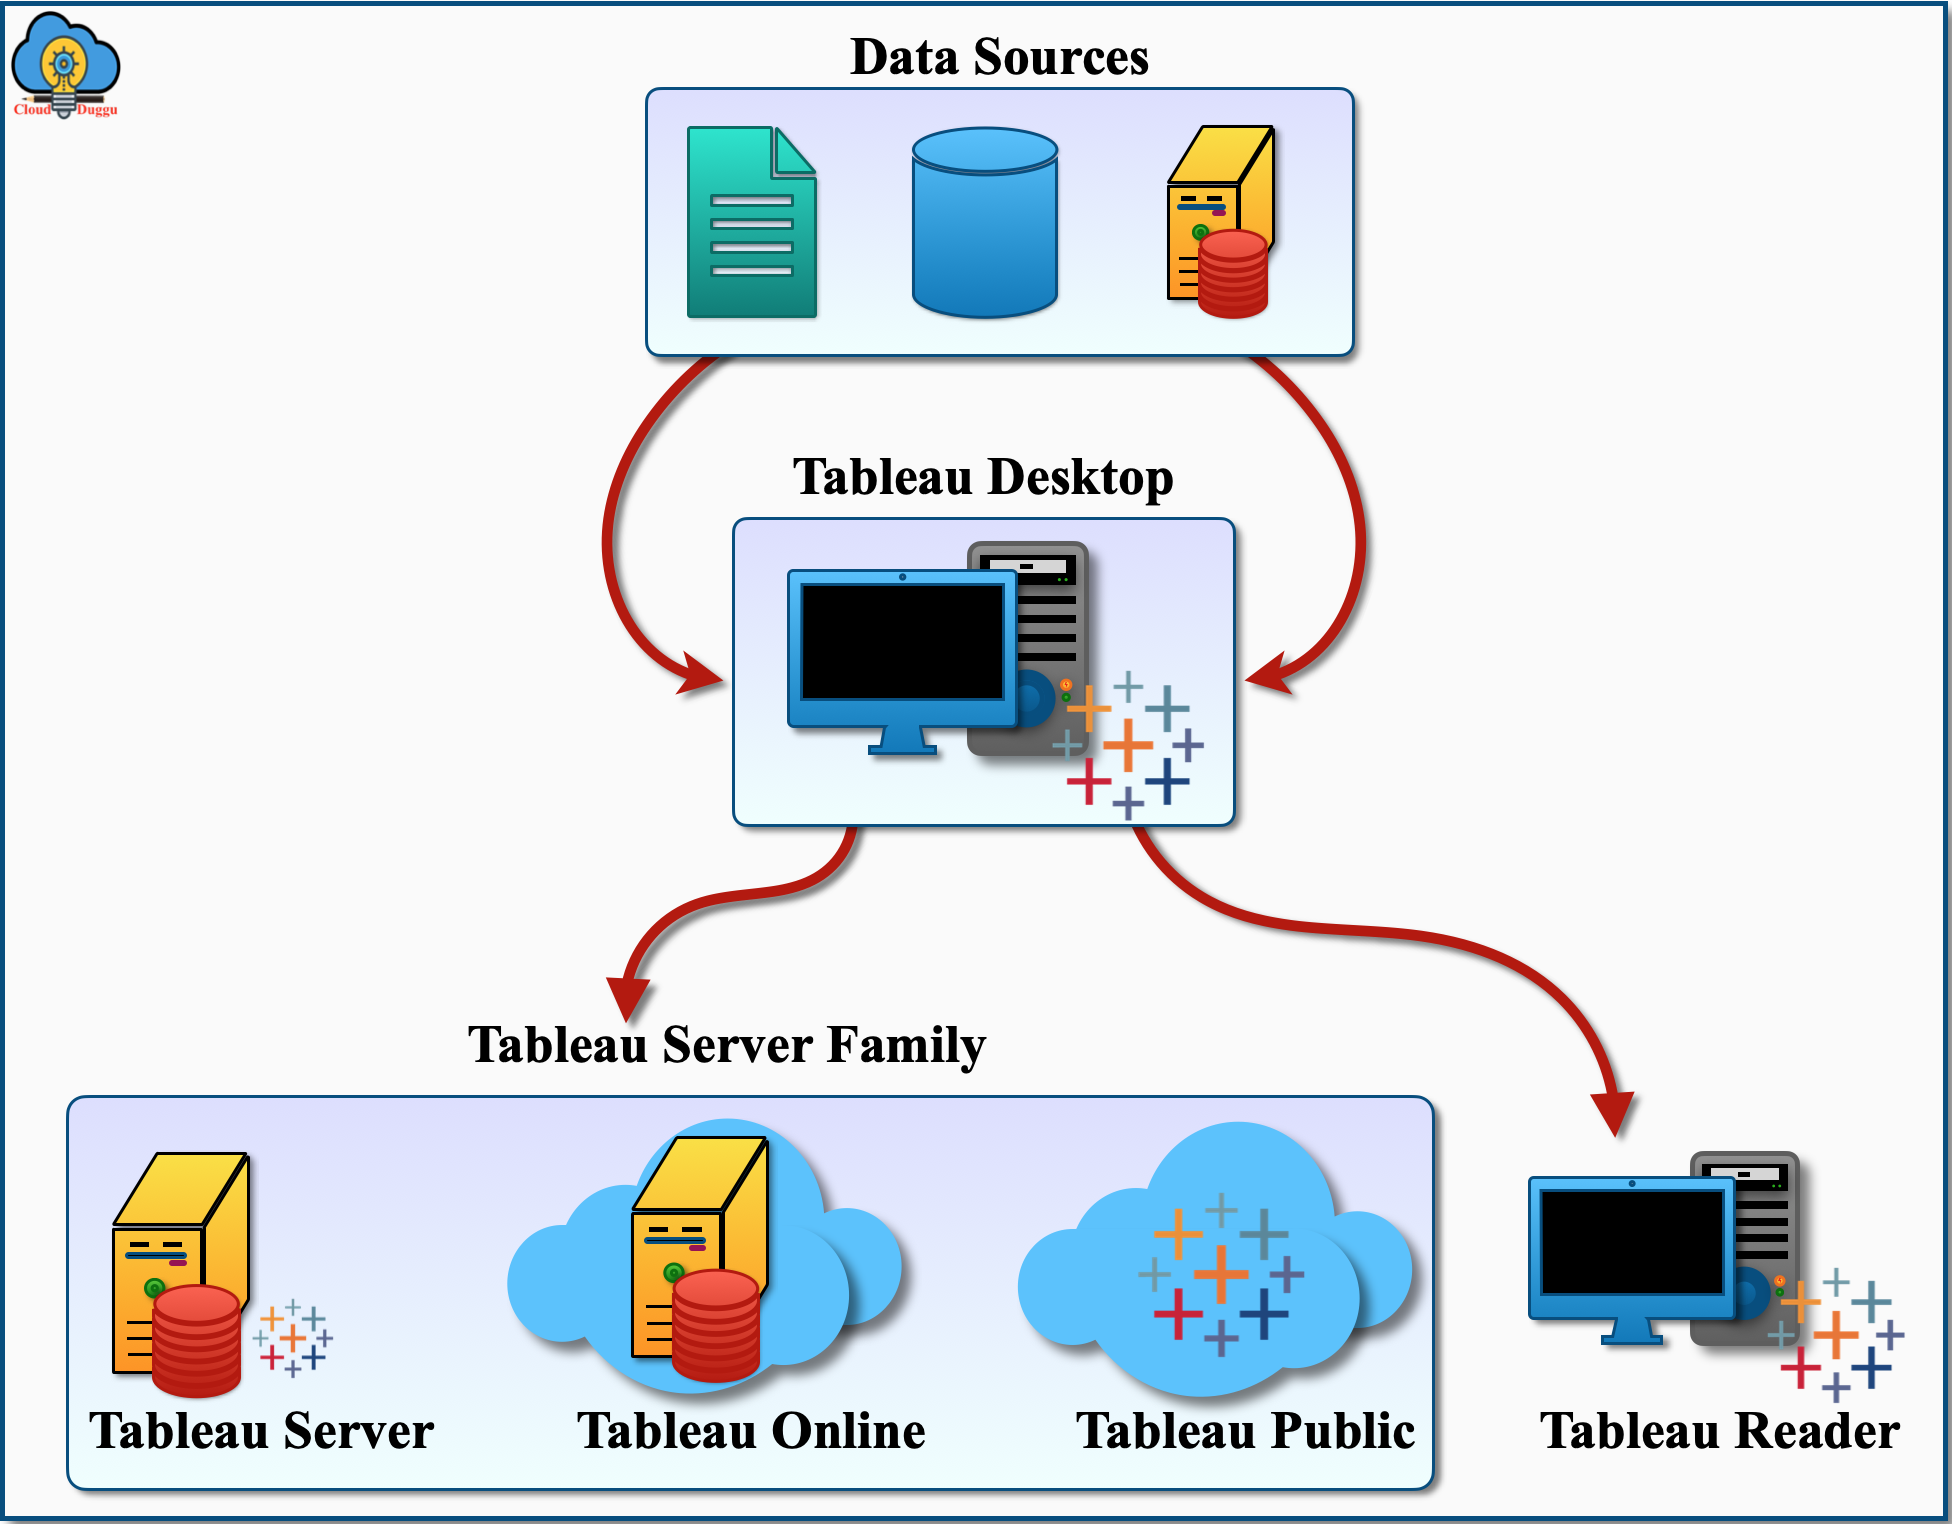
Tableau Products
The following is the list of Products supported in Tableau.
- Tableau Desktop
- Tableau Server
- Tableau Online
- Tableau Prep Builder
- Tableau Vizable
- Tableau Public
- Tableau Reader
- Tableau Mobile
- Tableau CRM
Tableau Advantages
Let us see the advantages of Tableau in the below section.
- Tableau provides an excellent user interface and data virtualization.
- The training cost of Tableau is very less.
- Tableau is very easy to learn and implement.
- Tableau is capable of handling large datasets without compromising on performance.
- Tableau provides the support of a data Interpreter.
- Tableau provides good customer support.
Tableau Disadvantages
Let us see the disadvantages of Tableau in the below section.
- Tableau does not have custom visual imports.
- There is no option for scheduling.
- The screen resolution handling is poor.
- Comparatively, Tableau is costly.
- There is no versioning and change management.
- The parameter update is manual.
Difference between Tableau and Power BI
Let us see some of the major differences between Tableau and Power BI.
| Tableau | Power BI |
|---|---|
| Tableau provides the support for self-service BI. | Power BI also provides support for self-service BI. |
| It can connect to multiple data sources to process data. | Power BI can also connect to multiple data sources to process data. |
| The virtualization reports can be viewed on different devices. | Using Power BI also the virtualization reports can be viewed on different devices. |
| There is no such technical expertise is required to work on Tableau hence the training cost is less. | To operate the Power BI, a high level of DAX knowledge is a must which costs more on training. |
| Tableau offers customized user-specific visual dashboards and its licensing is based on the per-processor model. | Power BI costs and licensing are based on a per-user model view. |
| Tableau provides the feature of storytelling. | Power BI supports the feature of Q&A. |
| Tableau can customize the tooltip content based on the user requirement. | Power BI also provides the customization of tooltip content. |
Tableau A Leader in Gartner Magic Quadrant For BI
As per the report from Gartner Magic Quadrant, Tableau has been a leader in Analytics and Business Intelligence Platforms for 9 consecutive years.
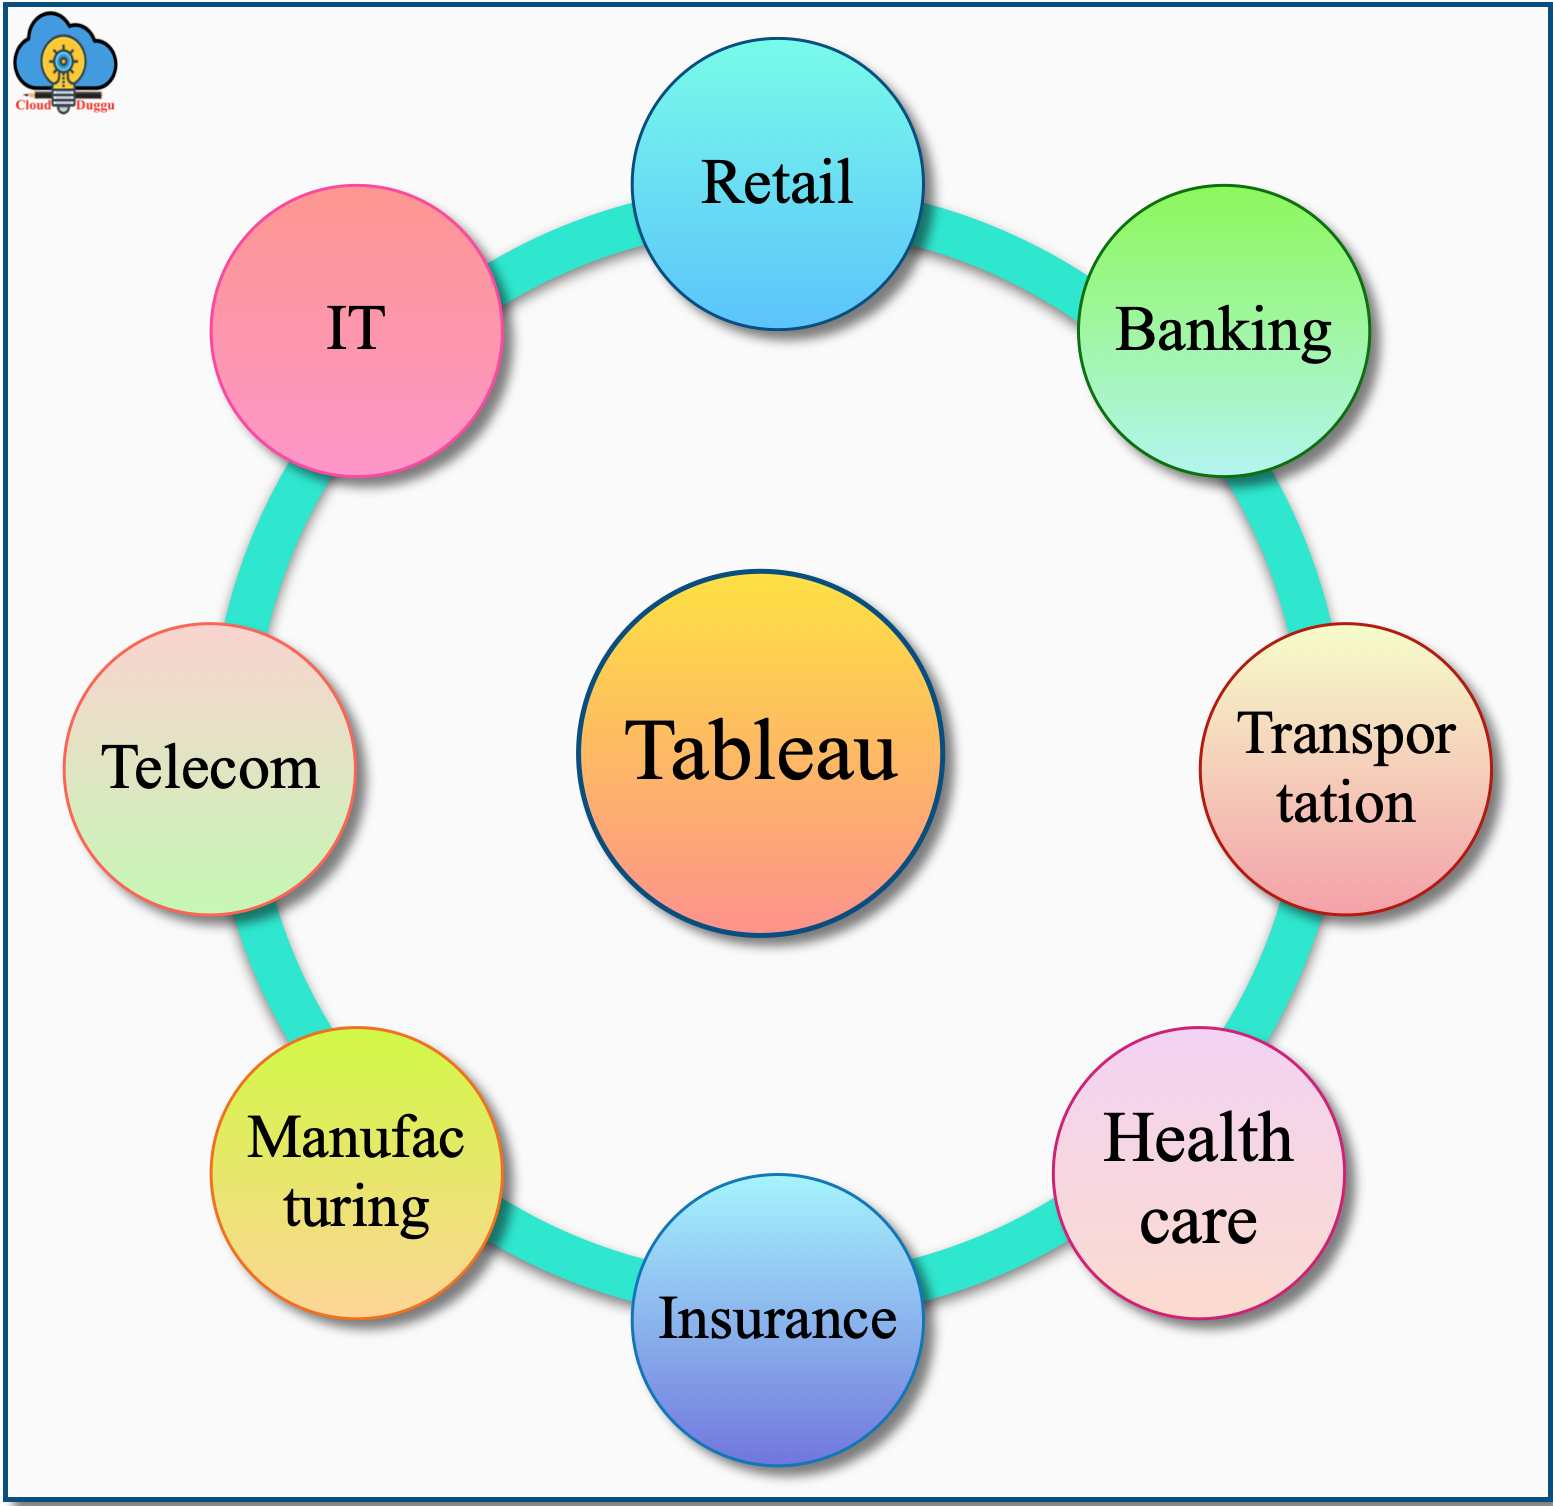
Organization using Tableau
Almost all organizations have started using Tableau starting from retail, communication to transportation. There is more than 25000 organization across the globe that are using Tableau due to its drag and drop functionality and a few of them are Coca-Cola, Pepsico, Walmart, Yahoo, Ferrari, and so on.
The following figure represents the sectors of the organization where Tableau is being used.