1. What is Tableau?
Tableau is the world-famous Business Intelligence Data analytics tool that is used by many organizations across the globe to perform visual data analysis. Tableau was established in 2003 by Christian Chabot, Pat Hanrahan, and Chris Stolte. Tableau helps to create a beautiful and information Dashboard that provides trends, variation, etc in the form of Graphs, Charts. It can connect with almost any kind of data source such as Cloud Databases. Spreadsheet, relational databases, online analytical processing cubes, and so on. Tableau helps organizations to understand in-depth data to make a critical business decision.
2. What are the Software products Tableau offers?
Tableau offers the following list of Software Products.
- Tableau Server
- Tableau Desktop
- Tableau Online
- Tableau Prep Builder
- Tableau Vizable
- Tableau Public (Free Version)
- Tableau Reader (Free Version)
- Tableau Mobile
- Tableau CRM
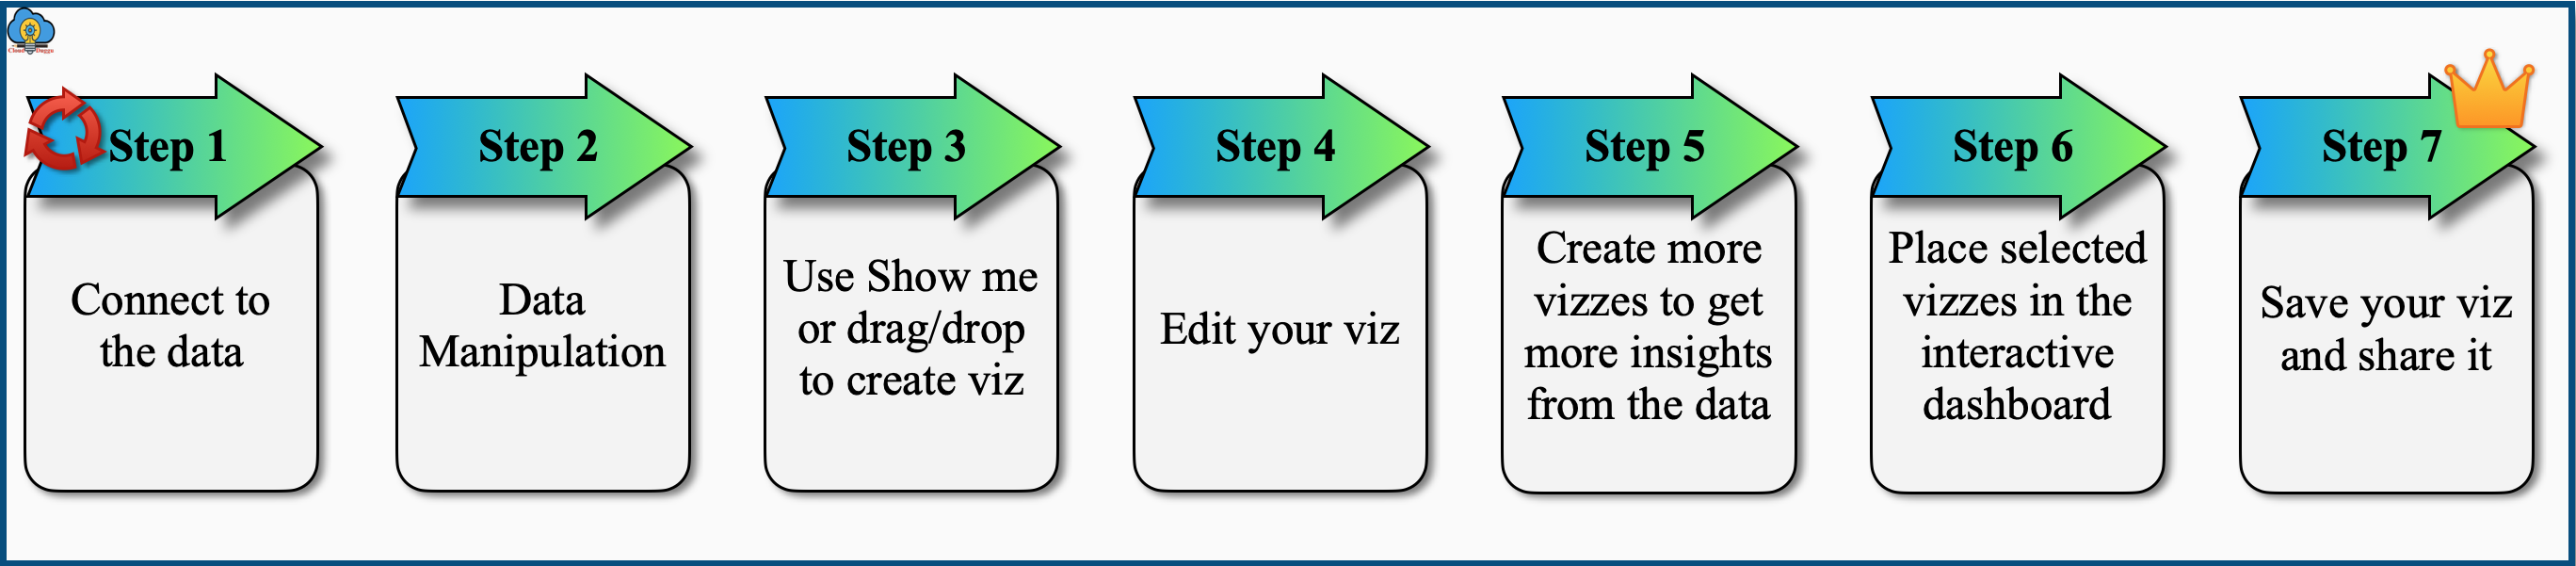
3. Define the steps that Tableau Offers to quickly create and provide insight from data?
The following are the steps that can followup to create insight data trends in Tableau.
4. What are some of the Important Features of Tableau?
The following are some of the important features of Tableau.
- Tableau Dashboard for a complete view of data.
- Collaboration with other users and for sharing the sheets, dashboards.
- Live and In-memory Data fetching data from data sources for real-time updates.
- Tableau offers a variety of Data Sources starting from in-house to cloud systems, spreadsheets to RDBMS.
- Provides the Advanced Visualizations using different Charts types such as Bar chart, Pie chart, Histogram, Gantt chart, Bullet chart, Motion chart, Boxplot
- Tableau provides Maps features to provide more informative data such as postal codes, city detail, etc, It also offers different types of Maps such as Point distribution map, Flow map, Choropleth maps, Heat map, and so on.
- Tableau best and Robust Security by using the Active Directory, Kerberos security protocols.
- Tableau provides Mobile View by offering customized mobile layouts.
- The Trend Lines and Predictive Analysis are the important features of Tableau using that we can get the future data predictions.
5. What is Data Virtualization?
Data Virtualization is a process through which we can see the insight of data from multiple data sources in the form of Visual Graphs, Trends, and so on. It requires no detail of the source system like how data is stored in the source system and how the formatting is done. The capability provided by Data Virtualization is Abstraction, Virtualized Data Access, Transformation, Data Federation, Data Delivery.
6. What are the Datatypes in Tableau?
The following is the list of Data Types offered by Tableau.
- Text (string) values
- Date values
- Date & Time values
- Numerical values
- Boolean values
- Geographic values (used with maps)
7. What are the different types of files in Tableau?
The following is the list of different types of files in Tableau.
- Workbooks(.twb)
- Bookmarks(.tbm)
- Packaged Workbooks (.twbx)
- Extract (.hyper or .tde)
- Data Source (.tds)
- Packaged Data Source (.tdsx)
8. What is the maximum number of tables that we can join in Tableau?
The maximum number of tables that we can join in Tableau is 32?
9. What are Measures in Tableau?
Tableau Measures are used to measure the quantity of the data. It is used by the dimension table for analysis. Tableau stores Measures in a table that has foreign keys associated with the dimension tables. The storage of the table is supported at the atomic level hence many records can be inserted.
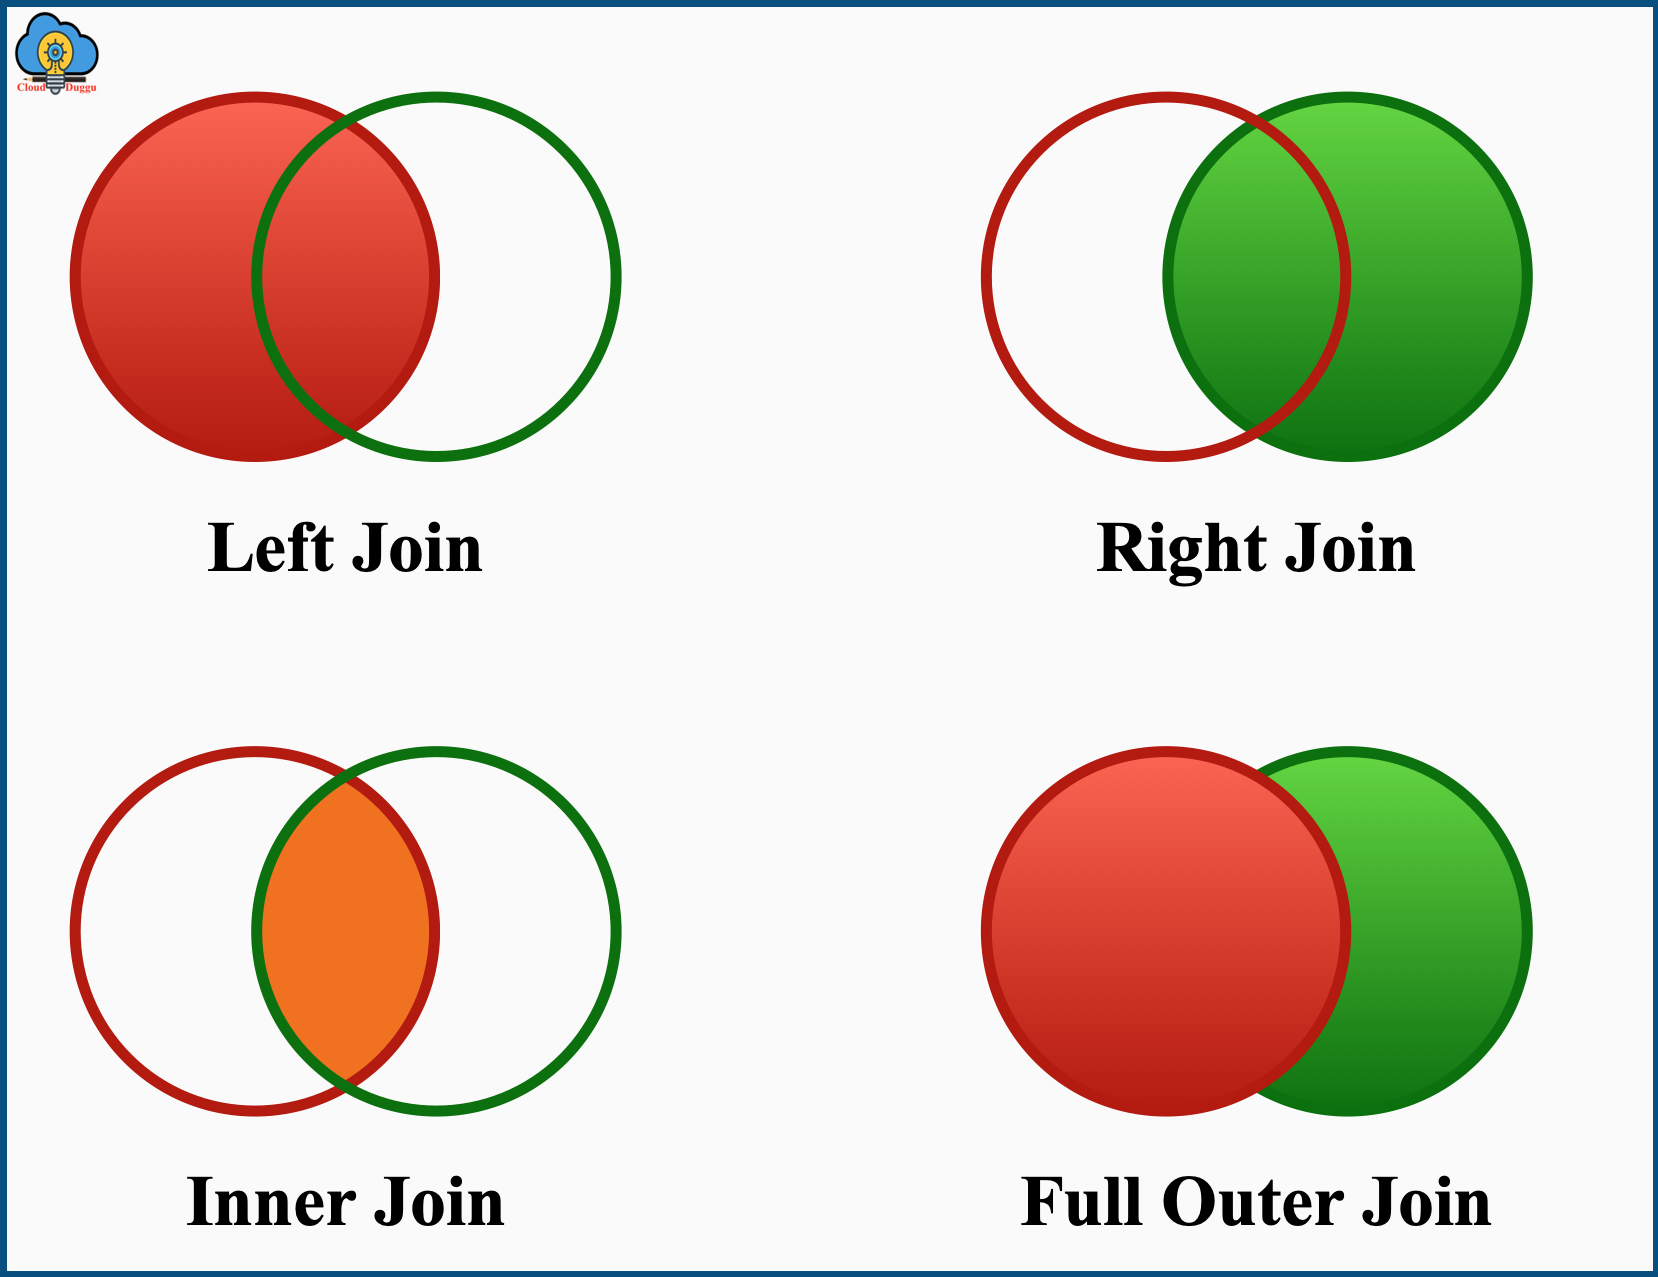
10. What are the different types of joins available in Tableau?
Tableau supports the joins which are Left Join, Right Join, Inner Join, Full Outer Join as mentioned in the below screenshot.
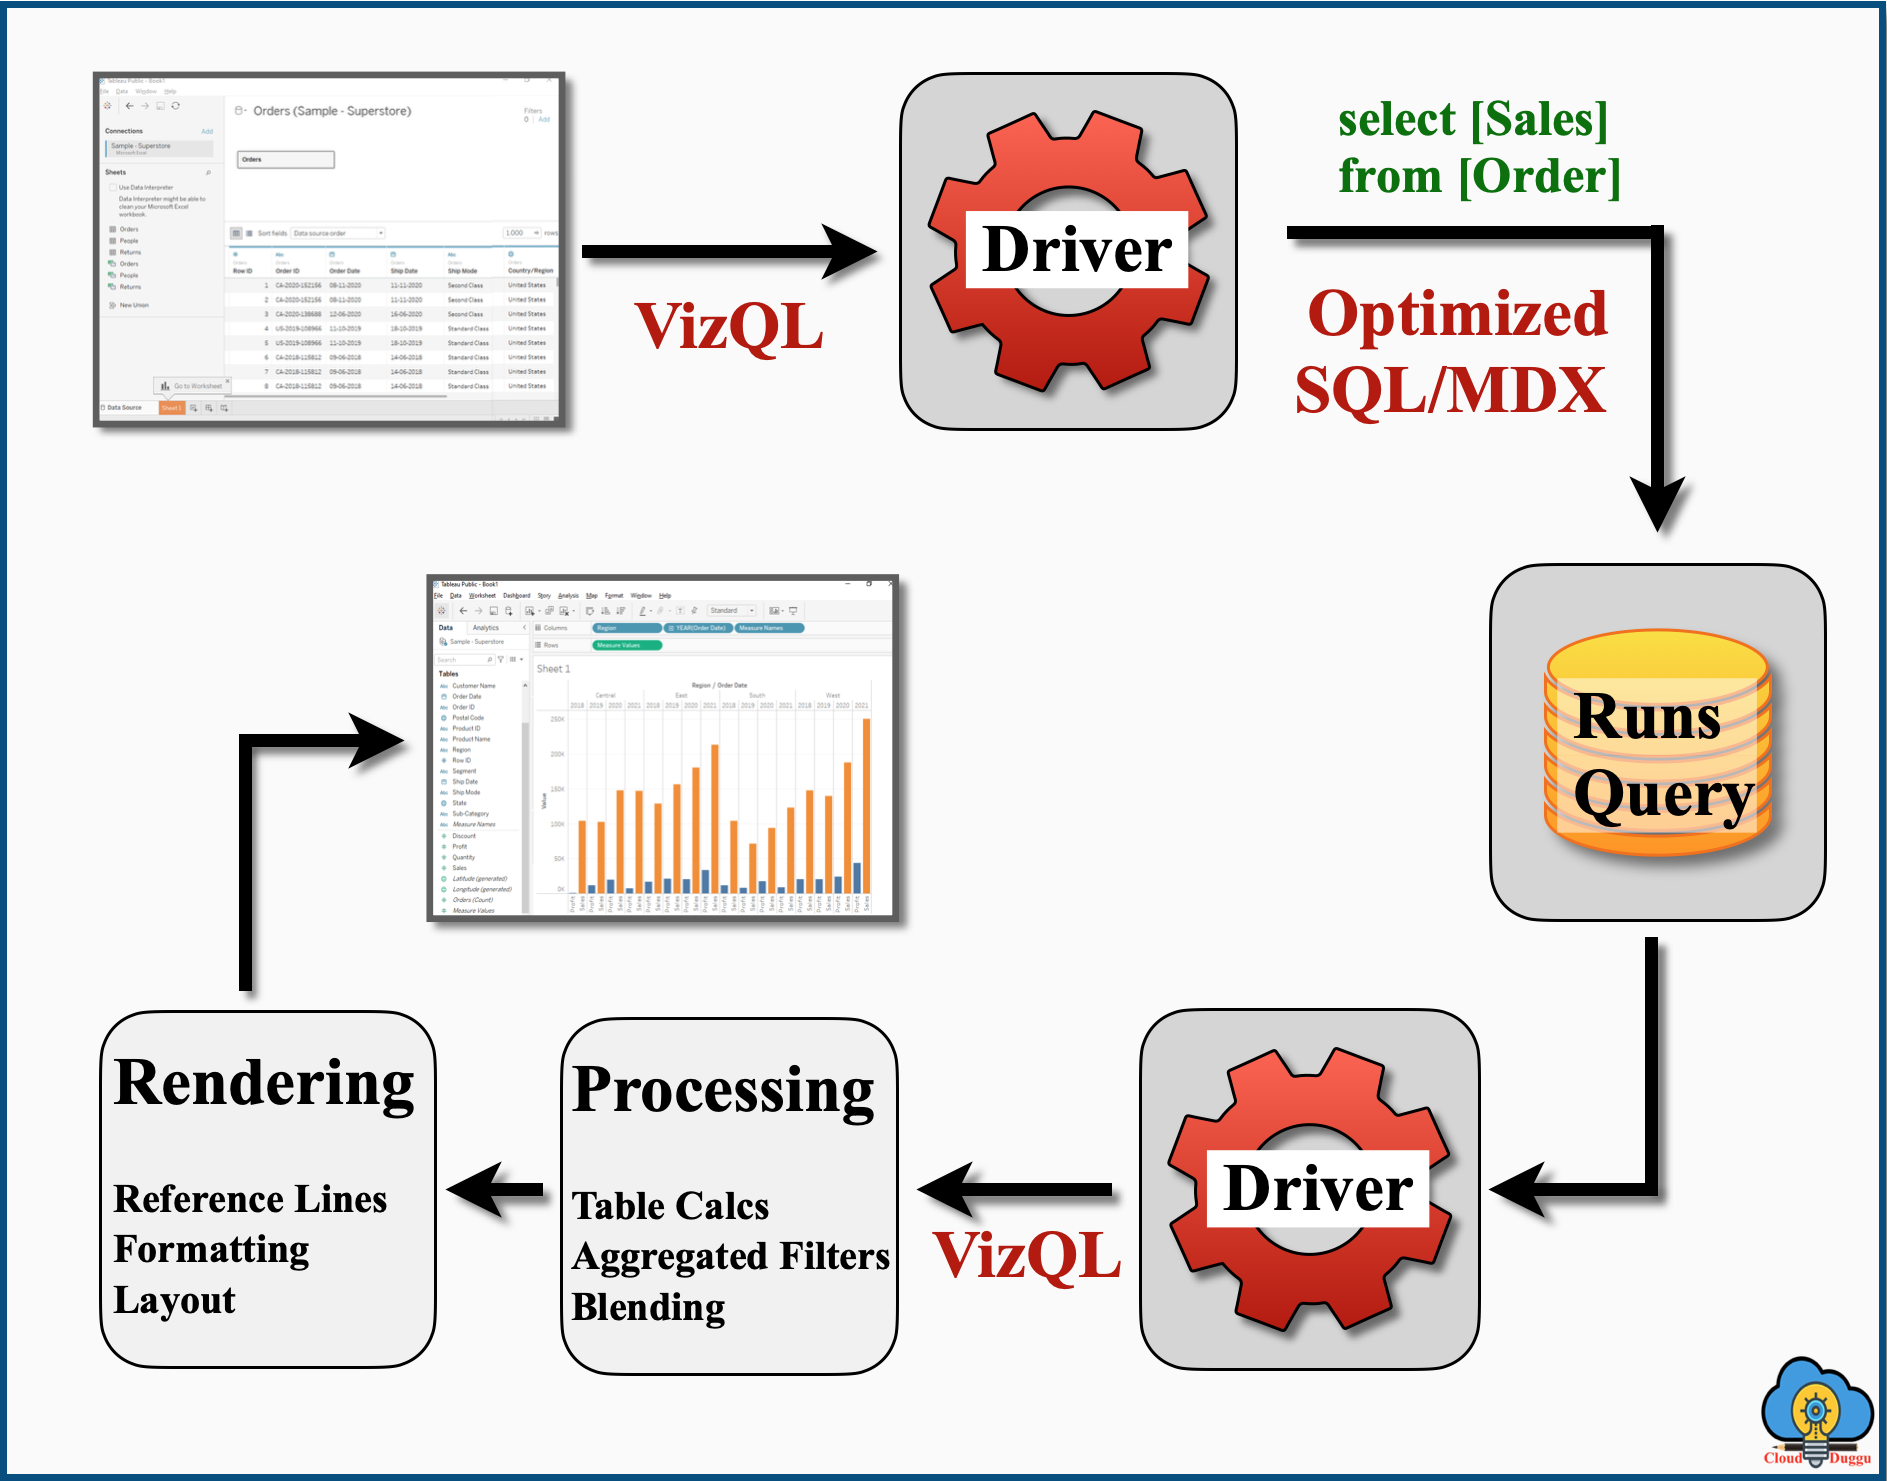
11. What is VizQL in Tableau?
The VizQL stands for Visual Query Language. It is a query language in Tableau that is a combination of VIZ and SQL and is used for converting data queries into Visual images.
The following figure represents the Architecture and Flow of Tableau VizQL.
12. What is Tableau Dashboard?
Tableau Dashboard consists of many worksheets, various views intended to display more information from a single place. We can create Tableau Dashboard for those views which are being reviewed every day separately. When the data in the sheet is modified the related Dashboard is also modified and vice versa. We can access the Dashboard by clicking on the bottom of the workbook.
13. What are the components of Tableau Dashboard?
The following is the list of 5 main components of Tableau Dashboard.
- Web:- It represents the web pages that are embedded in the Tableau Dashboard.
- Horizontal Component:- In this layout component we can add the objects.
- Vertical Component:- In this layout component also we can add the objects.
- Image Extract:- Using this component we can upload an image in the Tableau Dashboard.
- Text:- This component allows to format and edit the text.
14. How to improve the performance of Tableau?
The following are some of the ways that we can use to improve the performance of Tableau.
- Always use the context filters.
- If the Fields are not used then hide those fields.
- To make the Tableau workbook run faster, use the Extract.
- If the Scope of data is decreased the volume of data will be decreased to provide fast processing.
- The number of marks on the views should be decreased so that information overloading can be avoided.
- The integer and boolean data types are fast in processing so use them despite using the strings.
- Always avoid unnecessary calculations and sheets.
- The indexing which is used for the table should be used for filtering.
15. What are the different ways to use the parameters in Tableau?
The following are some of the ways to use the parameters in Tableau.
- Filters
- Actions
- Auto Updates
- Changing Views
- Calculated Fields
- Measure-Swaps
16. What is Story in Tableau?
The Tableau Story is the collection of worksheets, Dashboards that are combined together to convey the insight of data. Each sheet involved in the story is called a story point. It represents the facts and outcome which is an important process in decision making. The Story can be published with users, audience, and web so that they can share new findings of data and ask questions.
17. What is Show Me in Tableau?
The Tableau Show Me option is used to create the views based on the fields selected. It provides different types of Charts, Graphs to represent the data in a more informative way. To use Show me, we need to select the data and then the type of View that we want from the Show Me panel, Tableau automatically creates that view. Tableau Show by default highlights the View which is best suitable for the data.
18. What do understand by Forecasting in Tableau?
Tableau Forecasting is used to perform the prediction of future value. Tableau uses the exponential smoothing technique to achieve forecasting. To achieve the future forecast value, the exponential smoothing method finds the regular pattern in measures that will be continued in the future.
19. What type of connection can you make with Tableau Dataset?
We can make the following two types of connection with Datasets.
1. Live Tableau Connection
The Tableau Live connection is used to make a connection directly to the Data source and fire query on the data source to get the data. For example, if we are connecting to Teradata Database then we will be making a live connection on the Teradata Database and running the SQL queries to fetch the data.
2. Extract Tableau Connection
In the Tableau Extract connection, a static snapshot of the data is taken. In this connection, the data is refreshed at a certain period regularly. The refresh can be done incrementally or complete data refresh.
20. What are the different types of Maps available in Tableau?
The following are the different types of Maps available in Tableau.
- Spider maps
- Heatmaps
- Proportional symbol maps
- Choropleth maps
- Point distribution maps
- Flow maps
21. What are the Connectors supported in Tableau?
The following are the list of Connector supported in Tableau.
- Microsoft Excel
- Text File
- Microsoft Access
- JSON File
- PDF File
- Spatial File
- Statistical File
- Other Files
- Tableau Server or Tableau Online
- Actian Matrix
- Actian Vectorwise
- Alibaba AnalyticDB for MySQL
- Alibaba Data Lake Analytics
- Alibaba MaxCompute
- Amazon Athena
- Amazon Aurora for MySQL
- Amazon EMR Hadoop Hive
- Amazon Redshift
- Anaplan
- Apache Drill
- Aster Database
- Azure Data Lake Storage Gen2
- Azure SQL Database
- Azure SQL Synapse Analytics
- Box
- Cloudera Hadoop
- Databricks
- Datorama by Salesforce
- Denodo
- Dremio by Dremio
- Dropbox
- Esri ArcGIS Server
- Exasol
- Firebird 3
- Google Ads
- Google Analytics
- Google BigQuery
- Google Cloud SQL
- Google Drive
- Google Sheets
- Hortonworks Hadoop Hive
- IBM BigInsights
- IBM DB2
- IBM PDA (Netezza)
- Impala
- Intuit QuickBooks Online
- Kognitio
- Kyvos
- LinkedIn Sales Navigator
- MapR Hadoop Hive
- MariaDB
- Marketo
- MarkLogic
- Microsoft Analysis Services
- Microsoft PowerPivot
- Microsoft SQL Server
- MonetDB
- MongoDB BI Connector
- MySQL
- OData
- OneDrive
- Oracle
- Oracle Eloqua
- Oracle Essbase
- Oracle Netsuite
- Pivotal Greenplum
- PostgreSQL
- Presto
- Progress OpenEdge
- Qubole Presto
- Salesforce
- Salesforce CDP
- Splunk
- SAP HANA
- SAP NetWeaver Business Warehouse
- SAP SuccessFactors
- SAP Sybase ASE
- SAP Sybase IQ
- ServiceNow ITSM
- SharePoint Lists
- SingleStore
- Snowflake
- Spark SQL
- Teradata
- Teradata OLAP Connector
- TIBCO Data Virtualization (Cisco Information Server)
- Vertica
- Web Data Connector
- Other Databases (JDBC)
- Other Databases (ODBC)
22. What is the difference between published data sources and embedded data sources in Tableau?
In Tableau Published data sources the connection information is separate from the workbook and it can be used by multiple workbooks. In the Tableau Embedded data sources, the connection information is embedded with the workbook.
23. What is Tableau Public Verison?
The Tableau Public Verison is the free version provided by the Tableau organization to freely explore the data visualizations online. Using Tableau Public version any individual can create visualizations and publicize them freely. There are over a million data visualizations that can be used to explore more on Tableau.
24. What is Data Blending in Tableau?
Tableau Data Blending is a process of combining the data from multiple sources and displaying the data. In Data Blending the individual data sources are queried and the result is aggregated and the result is passed to the view. The Data Blending is performed better when the linking field varies sheet by sheet.
25. When should you use Joines and When to use Blending?
Joining in Tableau is helpful in those cases where the data is stored on a single data source. The Blending is used in those cases where we have to fetch the data from multiple sources. Blending uses the left join between the Primary data source and secondary data source.
26. What is the limitation of Tableau Public?
The following are some of the limitations of Tableau Public?
- Limited data source connections
- No local Saving
- No Automation
- Limited support
- Data limits
- Security concerns
27. What are the some of the Major Advantages of the Tableau BI Tool?
The following are the some of the Major Advantages of the Tableau BI Tool.
- Faster analysis, intuitive dashboards
- Increased organizational efficiency
- Data-driven business decisions
- Improved customer experience
- Improved employee satisfaction
- Trusted and governed data
- Increased competitive advantage
- Create interactive visualizations
28. What are the different types of Filters available in Tableau?
The following are the different types of Filters available in Tableau.
- Extract Filter
- Dimension Filter
- Data Source Filter
- Context Filter
- Measure Filter
- Table Calculation Filter
29. What are the Types of Charts and Graphs present in Tableau?
The following is the list of some of the Charts and Graphs present in Tableau?
- Bar Chart
- Line Chart
- Pie Chart
- Maps
- Density Maps
- Scatter Plot
- Gantt Chart
- Bubble Chart
- Treemap
30. What are the use cases of the Tableau BI Tool?
The following is the list of Tableau Use cases.
- IT: Maintaining the asset inventory of H/W and S/W, Using Tableau for helpdesk call management, Handling security patches.
- Finance: Using Tableau to perform the Budget planning, handling travel expenses, and so on.
- Marketing: Using Tableau to handle the Campaign management.
- Human Resources: Using Tableau to handle the headcount detail, new resourcing, and maintaining the CSAT of employees.
- Sales: Using Tableau to handle the Sales data.
- Facilities Operations: Using Tableau to handle the call flow, manage the physical location of Call centers, handle the request volumes, and manage resolution time.