The Tableau Data Blending is an important feature of Tableau that is used to analyze the data from multiple sources in a single view. For example, if we have employees data present in the RDBMS and the employee's department data is present in an excel sheet, Now to see the department detail we can blend the data based on the common dimensions. Tableau treats both sources like primary and secondary data sources and both data sources will be joined based on the left joining method to bring the required data.
Benefits of Tableau Data Blending
- Using Tableau Data Blending we can save the time of exporting data to excel or CSV.
- The cost of a complex ETL(Extract, Transform, Load) solution can be saved using the Tableau Data Blending Solution.
- Tableau Data Blending is dependent on the common key matches.
- Tableau Data Blending provides the answer to complex questions through interactive virtualization.
- Tableau Online helps to share the finding within the team.
Data Preparation For Tableau Blending
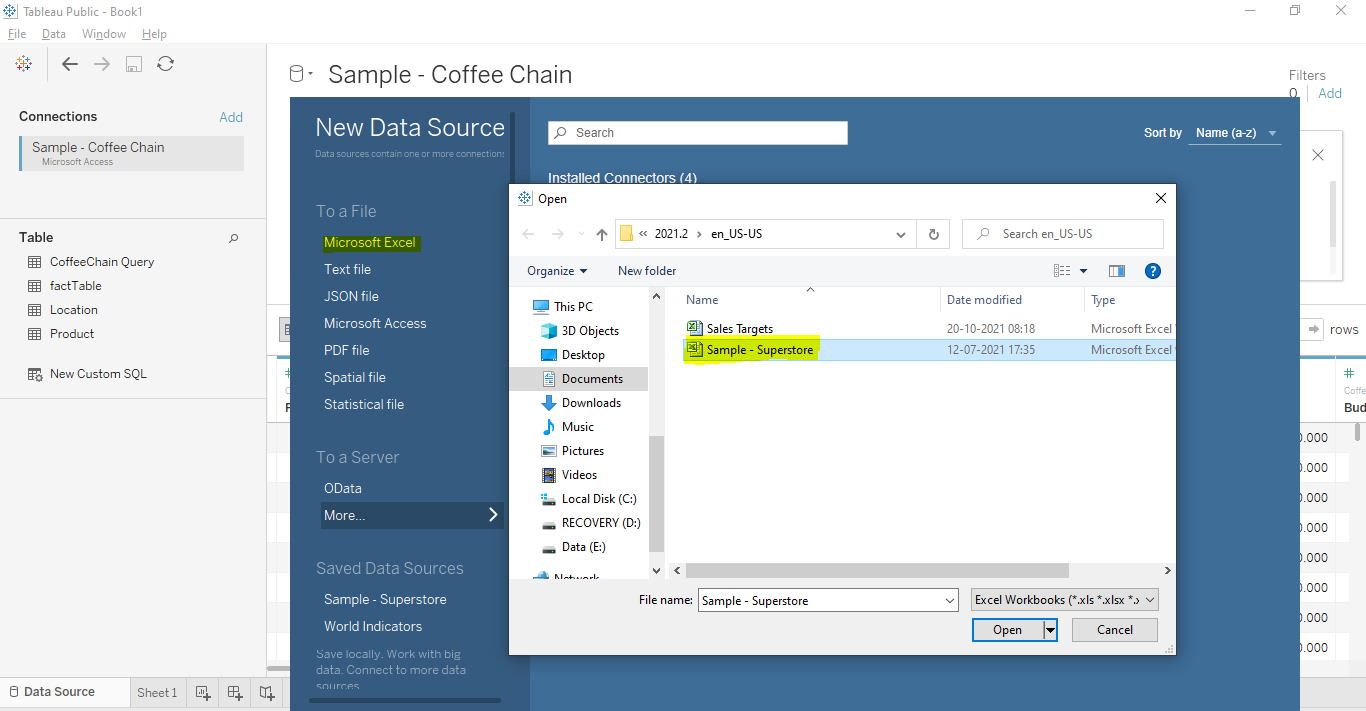
Tableau provides the default data sets namely "Sample-superstore" which is an excel file and "Sample coffee chain.mdb" which is an MS Access database file. First, we will follow the below step to load the sample coffee chain file.
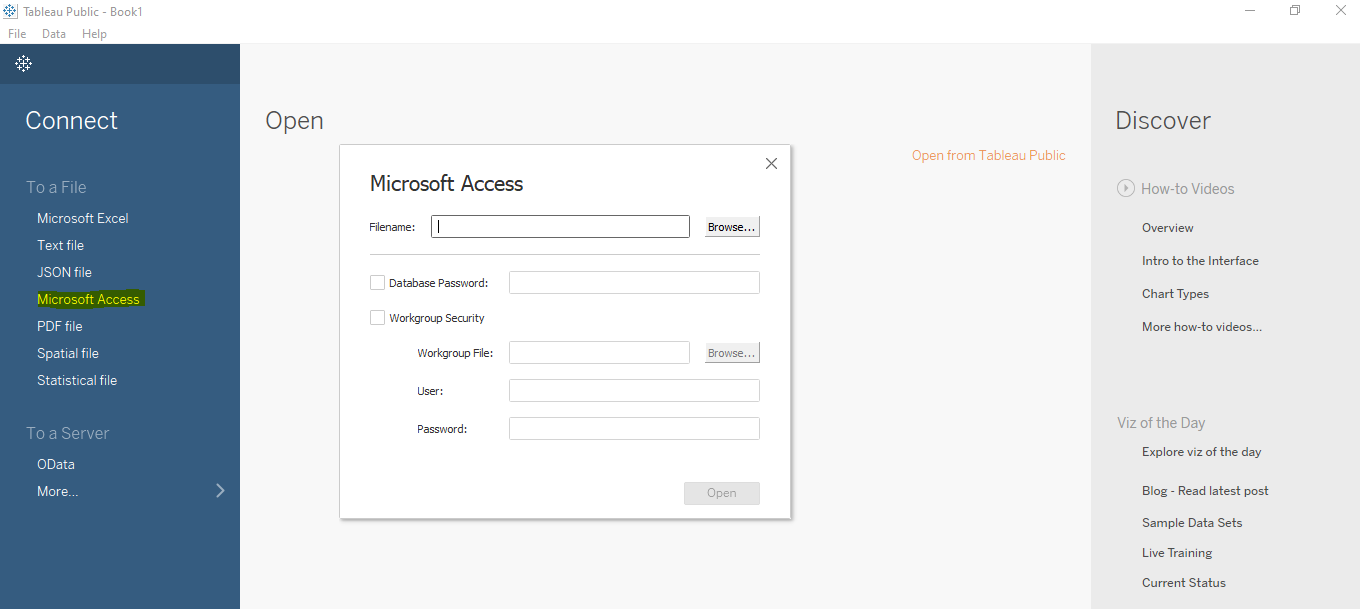
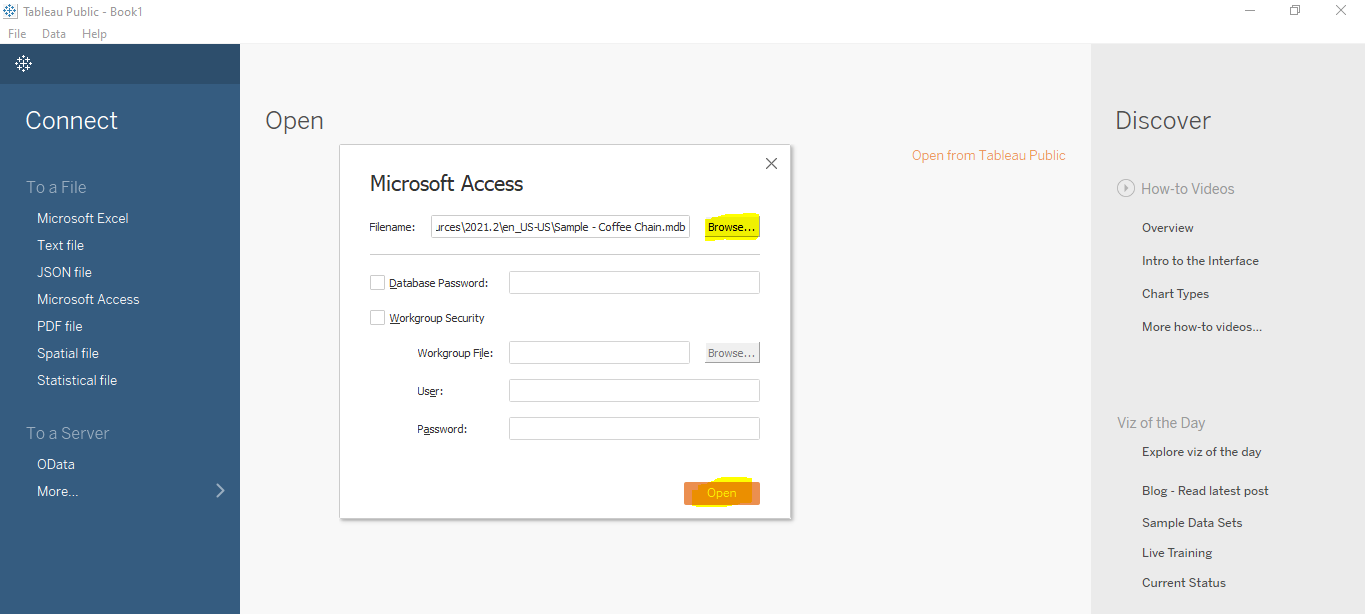
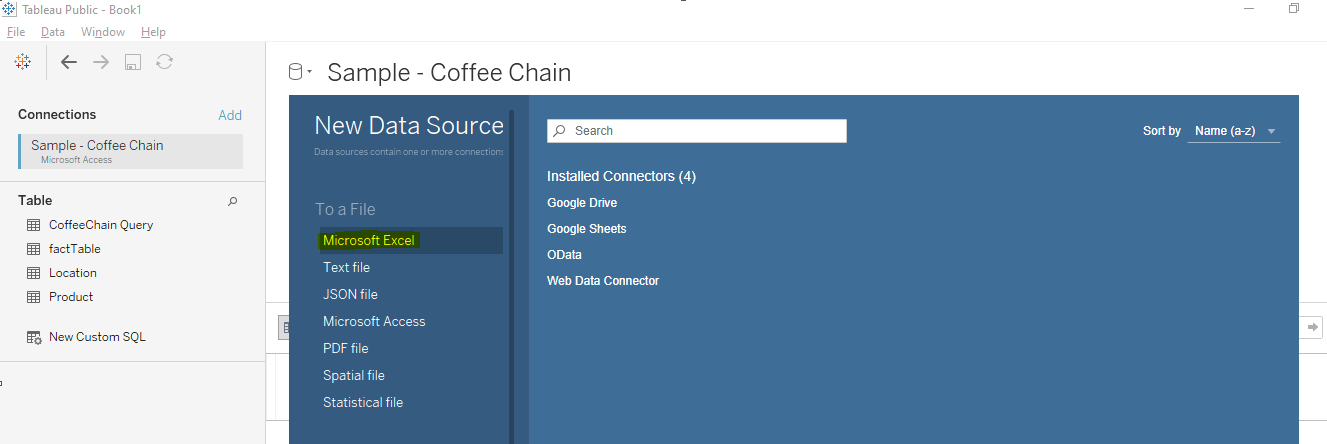
Open the Tableau and click on the "Microsoft Access" to load the "Sample coffee chain.mdb" file as mentioned below and select the file and click on the browse, once the file is selected post that clicks on the open button to open the file.
Once the data is loaded, drag the table in the canvas area as mentioned below.
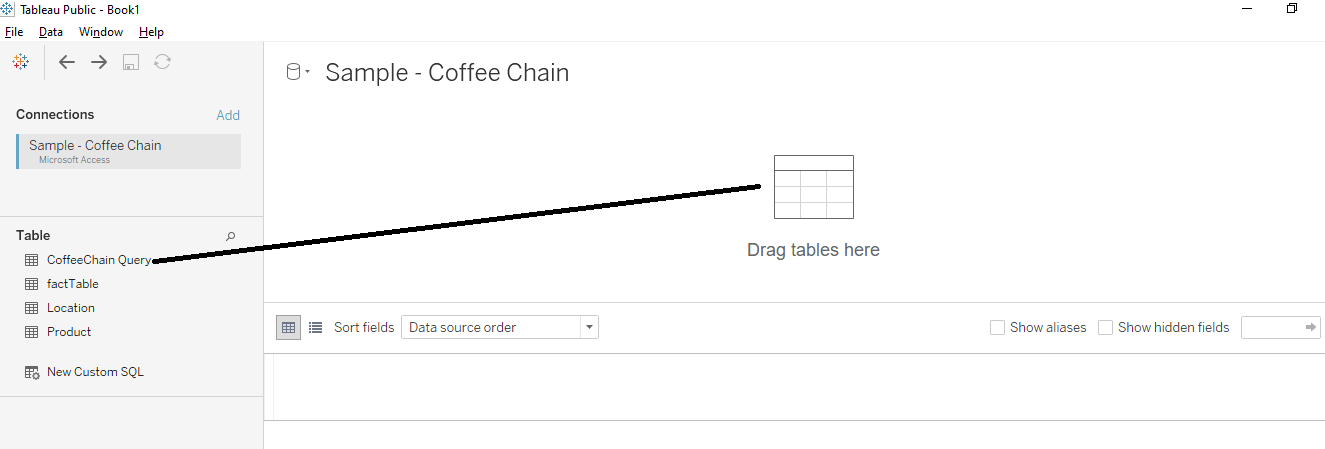
Now click on the OPEN to see the different types of joins that are available in the tables and drag and drop the other 3 tables one by one.
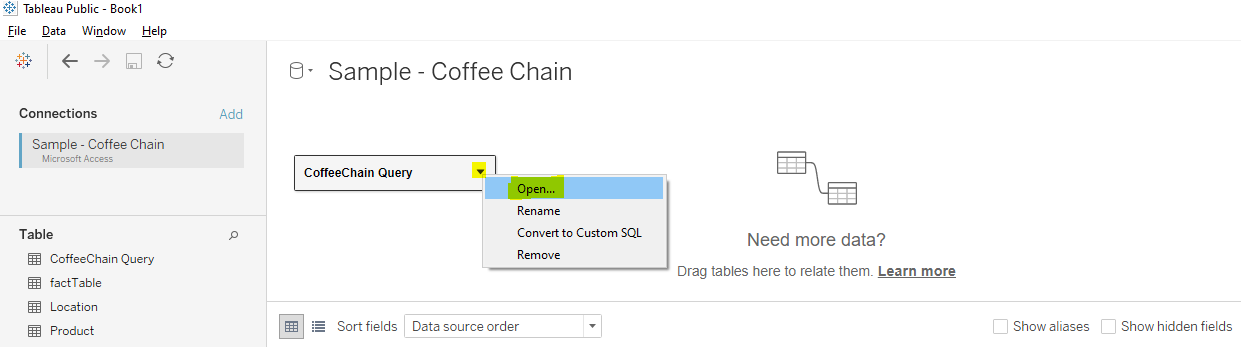
The below-joining condition will be created in tables.
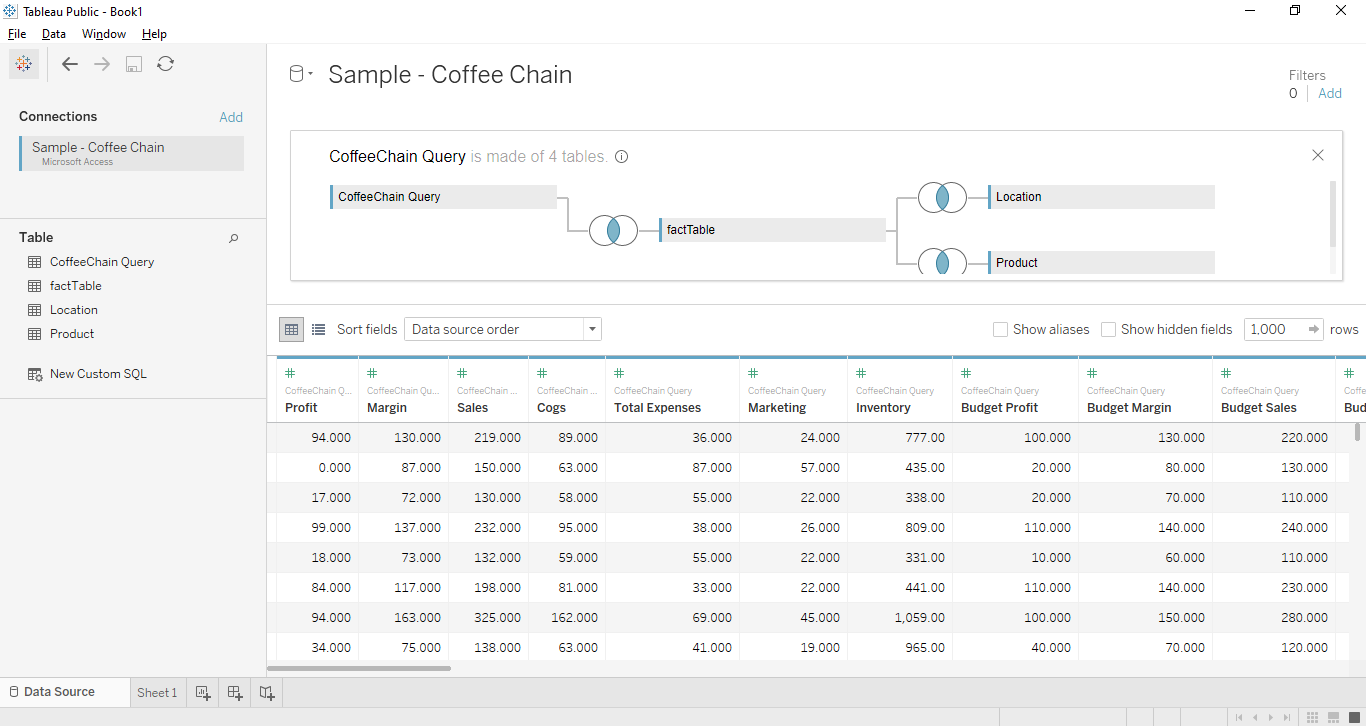
Secondary Data Source Addition
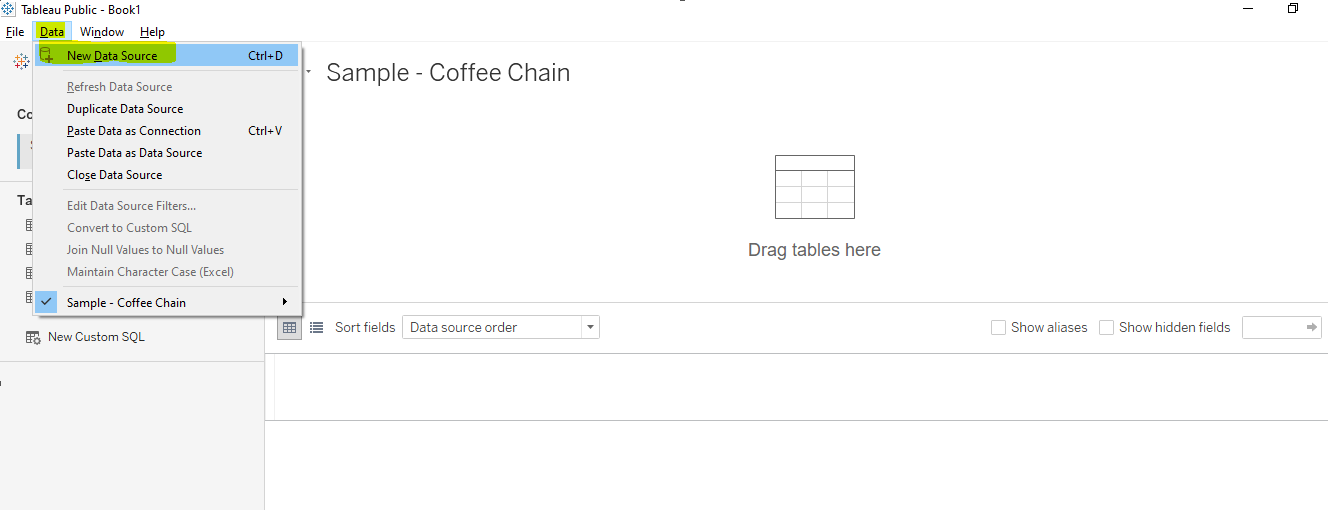
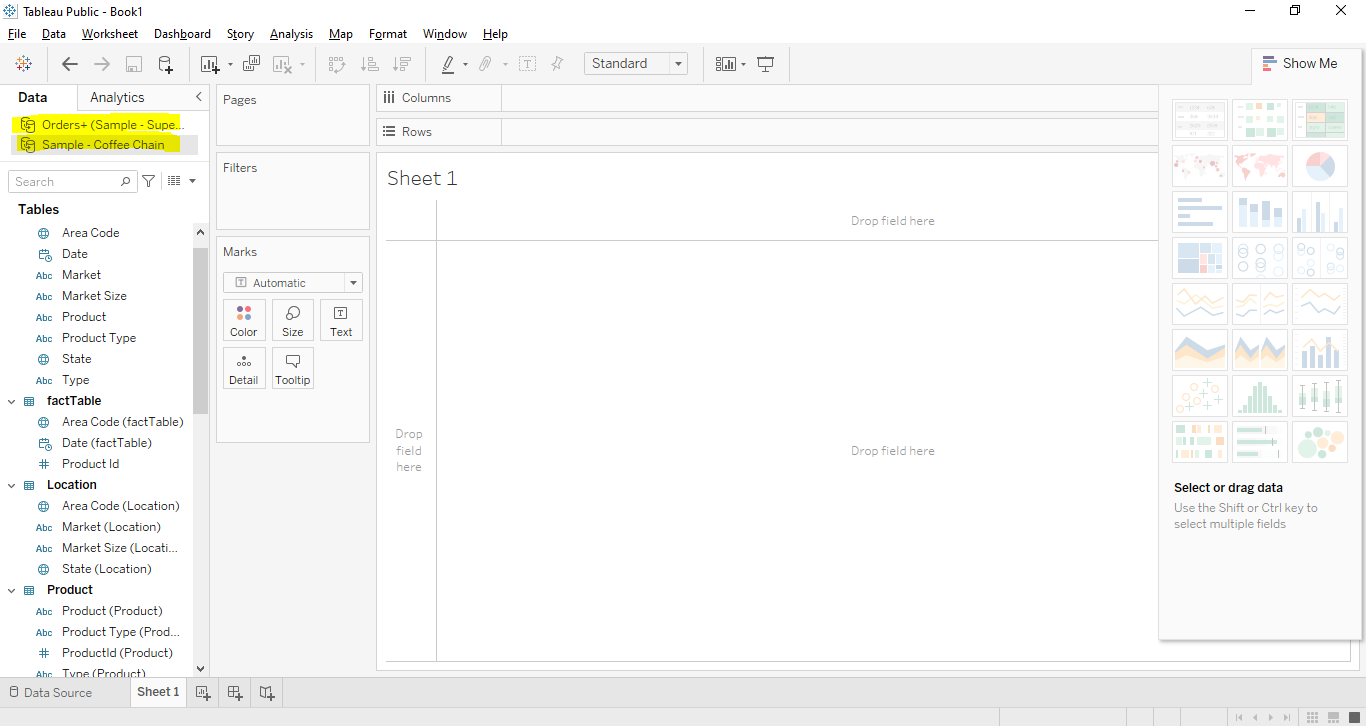
Now let's add the secondary data source "Sample-superstore". Go to MENU -> DATA → NEW DATA SOURCE and select the data source and perform the same operation which we did above by dragging down all tables in the canvas as mentioned in the below figures.
Once both the Primary and Secondary Data sets are loaded we can see them in the Data Window.
Blending the Data
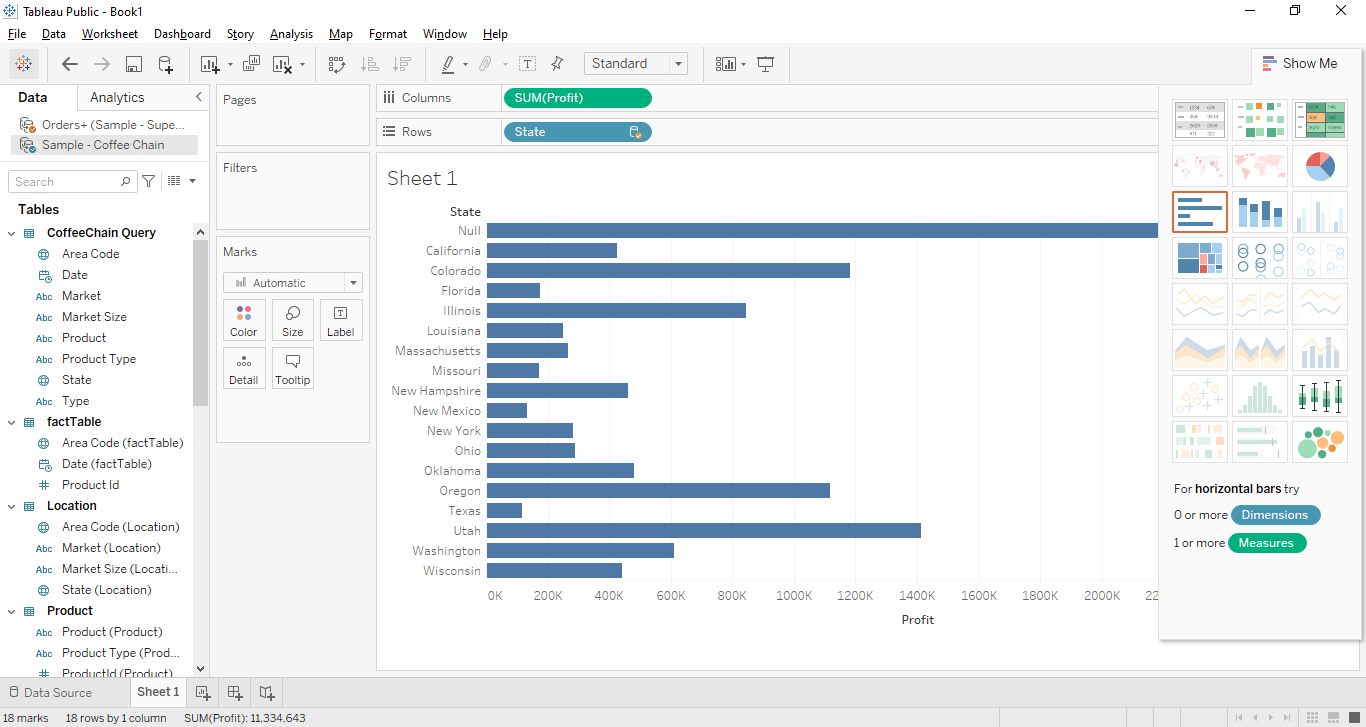
We are all set to perform the Data blending by integrating the common dimension from both Data Sources. Now let's drag the Profit column from the primary data source in the column field and State it into the rows from the secondary data source. The small chain image near the state dimension presents the common field which is there in both data sources.
The following charts show the profit for each state.